
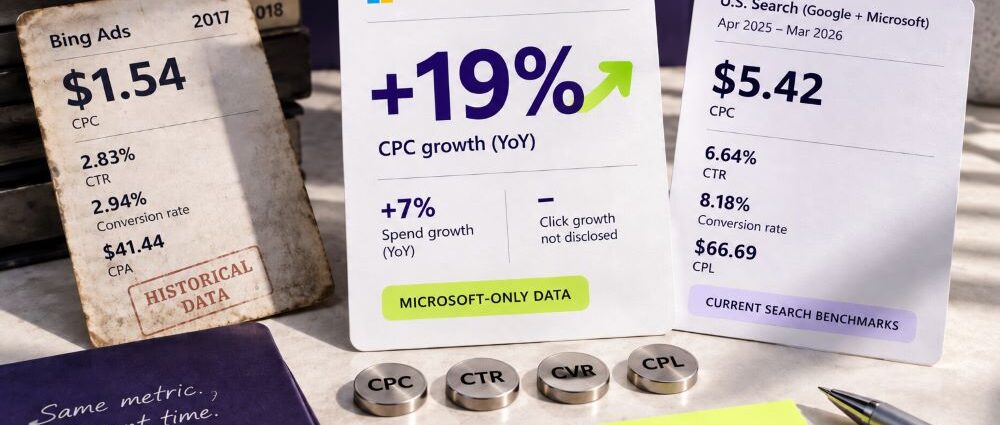
A $1.54 CPC still appears in articles labeled as current Microsoft Advertising benchmarks. A fresh U.S. search dataset reports $5.42, while Microsoft-specific data shows CPC rising 19% year over year in Q2 2026.
Those figures are not three versions of the same benchmark. The $1.54 CPC comes from Bing Ads accounts measured in 2017, the $5.42 figure comes from a current dataset combining Google and Microsoft search campaigns, and the 19% figure measures Microsoft CPC growth rather than absolute cost.
That difference matters before any benchmark reaches a dashboard. A number can be accurate in its original study and still become misleading once its date, platform scope or conversion definition disappears.
Which Microsoft Advertising Benchmarks Are Actually Current?
The strongest public data available in 2026 falls into three different groups. Microsoft-specific quarterly trends show how pricing and advertiser investment are moving, current cross-platform search studies provide useful absolute ranges, and older Bing Ads research belongs in the historical column.
| Metric | Figure | Period | Platform Scope |
|---|---|---|---|
| CPC growth | +19% YoY | Q2 2026 | Microsoft only |
| Paid-search spend growth | +7% YoY | Q2 2026 | Microsoft only |
| Search CTR | 6.64% | Apr 2025–Mar 2026 | Google + Microsoft |
| Search CPC | $5.42 | Apr 2025–Mar 2026 | Google + Microsoft |
| Search conversion rate | 8.18% | Apr 2025–Mar 2026 | Google + Microsoft |
| Search CPL | $66.69 | Apr 2025–Mar 2026 | Google + Microsoft |
| Bing Ads CPC | $1.54 | Jul–Sep 2017 | Microsoft only, historical |
WordStream’s current U.S. search benchmark covers 13,474 campaigns running from April 2025 through March 2026. It combines Google Ads and Microsoft Ads, so its CTR, CPC, conversion rate and CPL figures provide current search-market context rather than Microsoft-only averages.
Date alone does not make a comparison valid. A Microsoft-only trend, a blended search average and a historical Bing figure answer different questions even when all three appear on a benchmark page.
Microsoft CPC Growth Accelerated in 2026
Microsoft-specific data becomes more useful when it is read as a trend instead of forcing it into one absolute CPC figure. Tinuiti’s Q2 2026 Digital Ads Benchmark Report shows how sharply paid-search pricing conditions changed during the first half of the year.
Microsoft spend had risen 16% year over year in Q4 2025 while clicks increased 10% and CPC moved up 5%. Q1 2026 then brought 7% spend growth, a 5% decline in clicks and 12% CPC growth; by Q2, spend remained up 7% while CPC growth had reached 19%.
| Period | Spend Growth | Click Growth | CPC Growth |
|---|---|---|---|
| Q4 2025 | +16% | +10% | +5% |
| Q1 2026 | +7% | -5% | +12% |
| Q2 2026 | +7% | — | +19% |
The direction matters more than any single quarter. Advertiser spending continued to grow, but increasingly expensive clicks absorbed more of that increase as 2026 progressed.
Cheap Microsoft Clicks Are No Longer a Safe Assumption
Microsoft Advertising can still deliver lower CPCs than Google for a particular account, industry or query set. The 2026 trend makes that price advantage something advertisers need to verify inside the account rather than assume in advance.
A cheaper click also says little about what happens afterward. Conversion quality, acquisition cost and downstream revenue determine whether the apparent Microsoft price advantage survives beyond the auction.
Why a $1.54 Microsoft Ads CPC Is Not a 2026 Benchmark
The familiar $1.54 Microsoft CPC is not fabricated. WordStream measured it across 1,242 U.S. client accounts representing about $6 million in Bing Ads spend, and the same study reported a 2.83% CTR, 2.94% conversion rate and $41.44 CPA.
The problem is the date attached to those numbers. The accounts ran between July and September 2017, when the product was still called Bing Ads and both search behavior and the advertising market looked very different from 2026.
The original Bing Ads benchmarks also showed substantial industry variation. B2B Services averaged a $1.16 CPC, Home Services $1.50 and Technology $1.95.
Those figures remain useful for historical comparison. They are poor evidence for telling an advertiser what Microsoft Ads should cost today.
A benchmark does not become current because a new article republishes it. When a 2017 number appears inside a 2026 page without its original period, the data has not changed but its meaning has.
What Fresh 2026 Search Benchmarks Can Still Tell Us
Current blended search data gives Microsoft advertisers a useful market boundary. WordStream’s 2026 study covers more than 13,000 U.S. campaigns and places current search CPC at $5.42, with CTR at 6.64%, conversion rate at 8.18% and CPL at $66.69.
Those figures should not become Microsoft targets. Their value is more practical: they show what contemporary paid-search economics look like when a Microsoft account appears unusually cheap, expensive or inefficient relative to the broader market.
For an advertiser paying $6 per Microsoft click, that context can materially change the diagnosis. Comparing the account with a 2017 Bing average creates a very different conclusion from comparing it with current search economics.
Current Search Benchmarks Vary Sharply by Industry
The current Google-plus-Microsoft dataset shows why one platform-wide average has limited diagnostic value. Commercial intent, auction pressure and conversion behavior vary widely across industries.
| Industry | CTR | CPC | CVR | CPL |
|---|---|---|---|---|
| Business Services | 6.10% | $5.87 | 4.85% | $93.69 |
| Attorneys & Legal Services | 5.87% | $9.87 | 5.55% | $131.63 |
| Home & Home Improvement | 6.47% | $8.33 | 8.05% | $90.92 |
| Industrial & Commercial | 6.57% | $5.87 | 8.20% | $75.19 |
| Finance & Insurance | 9.83% | $3.39 | 2.64% | $74.44 |
Attorneys and Legal Services paid $9.87 per click in the dataset, almost three times the $3.39 recorded in Finance and Insurance. Finance still produced the higher CTR at 9.83%, showing how little one engagement metric says about the cost of traffic.
High CTR did not guarantee strong conversion either. Finance and Insurance converted at only 2.64%, while Industrial and Commercial reached 8.20% with a lower 6.57% CTR.
For Microsoft Ads industry benchmarks, the practical lesson is that industry economics and query value can outweigh the platform label. A Microsoft click does not become cheap or expensive in isolation from the market behind the search.
Microsoft Ads vs Google Ads Looks Different in 2026
The old Microsoft-versus-Google story was simple: smaller search network, less competition, cheaper clicks. That description still fits some accounts, but the pricing direction in 2026 makes it harder to use as a platform-wide rule.
Microsoft CPC growth reached 19% year over year in Q2 while Google Search pricing pressure remained much softer. That does not prove that Microsoft clicks now cost more in absolute dollars; it shows that the two platforms can move at very different speeds.
An advertiser can therefore pay less per Microsoft click and still see its Microsoft costs deteriorating faster. The meaningful comparison belongs inside the account, where CPC sits beside conversion rate, qualified-lead rate and revenue by platform.
Microsoft’s own advertising revenue growth adds market context, but it is not an advertiser benchmark. Revenue can move because of search volume, pricing, inventory or partner activity without telling one advertiser what CTR or conversion rate to expect.
Why Fresh Microsoft-Only CTR and Conversion Benchmarks Are Hard to Find
Fresh Microsoft-only CTR, conversion-rate and CPL averages are surprisingly difficult to verify in 2026. Public data supports current Microsoft CPC and spending trends far better than it supports comparable platform-only averages for the rest of the funnel.
Current search studies provide useful industry ranges, but they often combine Microsoft and Google campaigns. Older Bing-only reports provide platform-specific numbers but fail the freshness test.
A missing benchmark is better than a mislabeled one. Publishing a precise-looking Microsoft Ads conversion rate sourced from blended search data creates more certainty on the page without creating more knowledge for the advertiser.
Lead-generation accounts expose the problem quickly. A conversion may mean a phone call, demo request, form completion or another tracked action, while cost per lead and cost per qualified lead can tell very different stories about campaign performance.
Build a Microsoft Advertising Benchmark From Your Own Account
Once an advertiser has enough clean data, its own Microsoft Ads history should gradually become more important than a published industry average. The comparison then shifts from “Are we close to the market?” to “Is this segment improving against traffic that actually resembles it?”
Separate Brand and Non-Brand Search
Brand traffic often produces higher CTR and lower acquisition cost because the searcher already knows the company. Combining it with non-brand prospecting can make account-wide Microsoft Ads benchmarks look healthier without showing whether new-customer acquisition improved.
Brand and non-brand campaigns deserve separate baselines for CPC, conversion rate and cost per acquisition. That separation also makes sudden changes in auction pressure easier to spot.
Keep Search, Shopping and Audience Traffic Apart
A $4 account-wide CPC can hide a $2 Shopping campaign and $8 non-brand Search traffic. Once unlike inventory gets blended together, the average may look stable while one part of the account deteriorates.
Search demand, Shopping activity and audience-based traffic also create different user journeys. Keeping those environments separate makes a change in CPC or conversion rate easier to trace back to the part of the account that actually moved.
Move From Conversions to Qualified Outcomes
Lead-generation accounts need to follow performance beyond the conversion recorded by the ad platform. A cheaper form submission has little value if sales rejects most of the resulting contacts.
B2B PPC benchmarks show the same shift from raw CPL toward qualified pipeline. Microsoft Ads deserves that downstream view once enough CRM data is available.
An internal scorecard should separate media efficiency from business quality. At minimum, it can track:
- CTR and CPC by brand, non-brand and campaign type;
- conversion rate by meaningful conversion action;
- CPL or CPA by campaign and intent;
- qualified-lead rate and cost per qualified lead;
- opportunity or customer rate where CRM data is reliable;
- revenue or ROAS when sales can be connected back to acquisition.
Outside data remains useful for context, but it should lose influence as the account builds a stronger first-party history. At that point, Microsoft performance can be judged against comparable traffic rather than a broad industry average.
Use External Benchmarks to Find the Number That Looks Wrong
The most useful external benchmark is often the one that makes a single account metric look suspicious. An unusual CPC, conversion rate or CPL gives the team a place to investigate rather than a target to copy.
A CPC increase far above the wider market points toward auction pressure, query mix or campaign structure. Healthy CTR paired with weak conversion shifts attention toward intent, offer and landing-page performance, while a competitive CPL combined with worsening sales acceptance suggests that the inexpensive leads themselves may be the problem.
Cheap Microsoft traffic deserves the same scrutiny. For B2B lead generation with Microsoft Ads, a lower CPC than Google becomes an advantage only when those clicks survive the rest of the funnel and produce qualified opportunities.
A 2026 Benchmark Needs a 2026 Date Behind It
The clearest Microsoft-specific signal in 2026 is not a universal CPC, CTR or conversion rate. It is the direction of pricing: Microsoft CPC growth accelerated sharply from late 2025 through the first half of 2026 while spend growth slowed.
Microsoft Advertising benchmarks are most useful when their source and period remain visible. Current cross-platform search data still provides useful industry ranges, but it should remain labeled as Google-plus-Microsoft data.
The old $1.54 Bing CPC belongs in the historical column, not beside today’s campaign targets. A better hierarchy starts with fresh Microsoft-specific trends, narrows the comparison with current industry data, then gives the advertiser’s own segmented account history the most weight. A benchmark should help explain what looks unusual, not force every Microsoft Ads account toward the same number.