
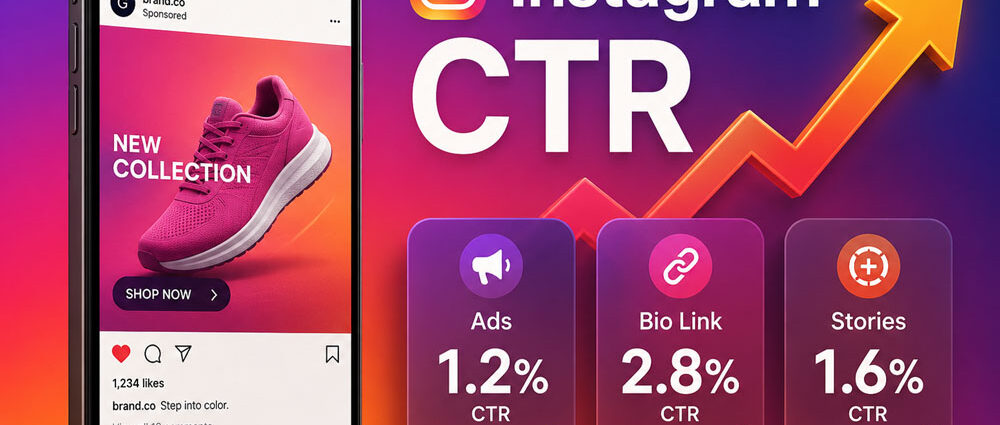
Instagram click through rate (CTR) tells you how often people click after seeing your ad, Story, Reel, post, or profile link. It is one of the fastest ways to see whether your creative, offer, and audience match each other.
Still, CTR can be misleading if you look at it alone. A high Instagram CTR can mean your content is relevant, but it can also mean people are curious without being ready to buy, sign up, or take the next step. A lower CTR can still be profitable if the clicks are qualified and convert well.
This guide explains what Instagram click through rate means, how to calculate it, what a good number looks like in 2026, and how to improve it without chasing empty clicks.
What Instagram CTR Means
Instagram CTR is the percentage of people who click after seeing your content or ad. In paid campaigns, CTR usually compares clicks with impressions; Meta defines click-through rate as clicks divided by impressions. In organic content, you may calculate it using profile visits, Story views, reach, or link taps, depending on what you are measuring.
The basic formula is:
CTR = clicks / impressions × 100For example, if an Instagram ad gets 900 clicks from 90,000 impressions, the CTR is:
1% = 900 / 90,000 × 100CTR is useful because it shows how well your content earns action. It does not show the whole picture, though. Conversion rate, cost per click, cost per lead, sales, sign-ups, and lead quality still matter after the click.
Quick Instagram CTR Benchmarks
Benchmarks vary because sources use different datasets, campaign objectives, industries, placements, and CTR definitions. A practical way to read the numbers is to treat them as ranges, not strict rules.
Before comparing two benchmarks, make sure they measure the same type of click. CTR (all), link CTR, outbound CTR, and unique CTR can reflect different user actions, so two reports may show different numbers without either one being wrong.
| Instagram Click Type | Rough Benchmark | What It Usually Means |
| Instagram ads overall | 0.5%–1.5% | Broad working range for many campaigns, depending on objective and placement |
| Feed ads | 0.7%–1.5%+ | Can perform strongly for direct-response clicks, but results vary by dataset |
| Stories ads | 0.3%–0.9% | Can work well with short creative and a clear CTA |
| Reels ads | 0.3%–1.2% | Often varies substantially with creative, audience, and objective |
| Warm retargeting | 1%–3%+ | Can run higher because the audience already knows the brand |
Public Instagram CTR datasets show why those ranges need context. For example, Emplifi’s Q2 2026 benchmark data for worldwide accommodation advertisers reported 0.40% CTR for Instagram Feed, 0.40% for Instagram Stories, and 0.25% for Instagram Reels. That specific dataset is not a universal Instagram average; it illustrates how placement, industry, audience, and methodology can pull real-world results below broad public ranges.
What Is A Good CTR On Instagram?
A good CTR on Instagram depends on what you are measuring. For many paid Instagram campaigns, anything around 1% can be a solid sign that the creative and audience are reasonably aligned. A CTR above 1.5% can look strong, especially for cold traffic, while 2% or more is a high attention signal that still needs to be checked against conversion quality.
A simple way to judge Instagram CTR:
| CTR Range | Basic Reading |
| Below 0.5% | Below many broad paid benchmarks; check placement, objective, and creative |
| 0.5%–1% | Common working range for many campaigns |
| 1%–1.5% | Often healthy, depending on objective and traffic quality |
| 1.5%–2% | Often strong if post-click performance also holds up |
| 2%+ | High attention signal; verify conversions and traffic quality |
The answer changes by placement. Feed, Stories, Reels, retargeting, cold traffic, and warm audiences can all produce different results. A good Instagram click through rate should always be judged together with conversion rate, cost per result, and traffic quality.
Is A 4% CTR Good?
Yes, a 4% CTR is usually very good on Instagram, especially for paid ads or cold traffic. It sits far above many public Instagram ad benchmark ranges.
But 4% CTR is not automatically profitable. If the ad attracts curiosity clicks but people leave the landing page, the campaign may still lose money. If the CTR is lower but the traffic converts into qualified leads, sales, or booked calls, the lower-CTR campaign may be better for the business.
A 4% CTR is a strong attention signal. The next question is whether that attention produces the right action.
Average Instagram Ads Click-Through Rate In 2026
There is no single average Instagram ads click-through rate for 2026 that applies to every campaign. Published results vary with industry, geography, objective, placement, audience temperature, creative format, and the exact CTR metric being reported.
As a broad working reference, many Instagram ad campaigns can fall somewhere around 0.5%–1.5% CTR, with stronger results possible when the audience is warm, the creative is clear, and the offer fits the placement. Current placement-specific datasets can sit below that range, which is why the source and methodology matter as much as the headline number.
The most useful comparison is usually your own past performance under similar conditions. Compare the same objective, audience type, placement, and CTR definition before deciding whether a campaign has genuinely improved.
Click Through Rate For Instagram Ads
Click through rate for Instagram ads is usually easier to track than organic Instagram CTR because Meta Ads Manager reports it directly. In ads, you may see different CTR metrics, including:
- CTR for all clicks
- link CTR
- outbound CTR
- unique CTR
- placement-level CTR
For serious analysis, link CTR or outbound CTR is usually more useful than all-click CTR. All-click CTR can include actions that do not actually send people to your landing page, such as profile taps or engagement actions. Outbound CTR is often closer to real traffic intent.
A good Instagram ad report should not stop at CTR. It should also compare:
- cost per click
- landing page views
- conversion rate
- cost per lead or purchase
- ROAS
- bounce rate
- lead quality
A high CTR with poor conversion rate often means the ad is interesting, but the landing page, offer, or audience is not aligned. Once clicks begin producing leads, lead generation benchmarks become more useful when acquisition cost is interpreted alongside conversion and lead quality rather than treated as the final performance measure.
Instagram Bio Link Click Through Rate Average
Instagram bio link click-through rate average is harder to benchmark than ad CTR because Instagram does not standardize bio-link reporting the same way Meta Ads Manager standardizes ad data. The number depends on follower intent, niche, profile quality, pinned content, CTA strength, and how often content pushes users toward the profile.
As a rough benchmark, some creator and affiliate marketing analyses place bio-link CTR around 2%–3%. That number can be useful, but it should not be treated as a universal Instagram bio link click-through rate benchmark for every account.
A creator with a loyal niche audience may beat that range. A brand with broad but low-intent followers may sit below it. The better approach is to track your own profile visits, external link taps, and final conversions over time.
Instagram Link In Bio Click-Through Rate Average
Instagram link in bio click-through rate average should be measured against profile visits, not total followers. A profile with 100,000 followers and weak profile traffic may get fewer link clicks than a smaller account with high-intent visitors.
A practical formula is:
Bio link CTR = bio link clicks / profile visits × 100For example, if a profile gets 5,000 profile visits and 150 bio link clicks:
150 / 5,000 × 100 = 3%That would be a strong sign that the profile CTA, bio copy, and link destination are working together.
To improve bio link CTR, make the next step obvious. Instead of a vague “learn more,” use a specific reason to click, such as a free checklist, product page, pricing page, booking form, or latest offer.
Instagram Story Link Click-Through Rate Benchmark
Instagram story link click-through rate benchmark numbers vary even more than ad CTR because Stories can be organic, boosted, sponsored, influencer-led, or retargeted. Story performance also depends on the sequence: the first frame, pacing, CTA, link sticker placement, and whether the audience already trusts the account.
For organic Stories, measure link taps against Story views or reach:
Story link CTR = link taps / Story views × 100A Story link CTR can improve when the Story has one clear message, one CTA, and a natural reason to tap. Too many slides, weak context, or a hidden link sticker can lower clicks even when views look healthy.
How To Find Click Through Rate On Instagram
How to find click through rate on Instagram depends on whether you are measuring ads, bio links, Stories, or website traffic.
For Instagram Ads
- Open Meta Ads Manager.
- Go to Campaigns, Ad Sets, or Ads.
- Customize columns.
- Add CTR, link CTR, outbound CTR, clicks, impressions, and landing page views.
- Compare CTR by placement, creative, audience, and objective.
For Instagram Bio Links
- Open Instagram Insights.
- Check profile visits and external link taps if available.
- Use a link-in-bio tool if you need more detailed click data.
- Add UTM tags to the destination URL.
- Check GA4 traffic from Instagram.
For Instagram Stories
- Open Story insights.
- Check reach or views.
- Check link taps.
- Calculate link taps divided by views or reach.
For Website Analytics
- Use UTM-tagged links.
- Check GA4 source and medium.
- Compare sessions, engagement rate, conversions, and revenue from Instagram traffic.
The key is to avoid mixing different CTR types. Ad CTR, bio link CTR, and Story link CTR are related, but they are not the same metric.
How To Improve Instagram CTR
Improving Instagram CTR is usually about making the next action feel obvious and worth it. The creative, audience, offer, placement, and destination all influence whether attention becomes a useful click.
Start with the creative. The hook should be clear in the first second for Reels or the first visual for Feed and Stories. If the user has to work too hard to understand the point, the click will not happen.
Then check the offer. A strong Instagram CTR often comes from a specific reason to click: a free guide, a limited offer, a useful product page, a calculator, a booking link, or a clear answer to a problem.
Practical ways to improve Instagram CTR:
- Use one CTA per post or ad
- Match the ad promise to the landing page
- Test Feed, Stories, and Reels separately
- Use UTM tracking for links
- Make Story link stickers obvious
- Improve the first line of captions
- Retarget people who already engaged
- Test different offers, not just different visuals
- Remove slow or confusing landing pages
- Track conversions, not only clicks
If CTR is low, the problem may be creative, audience, CTA, placement, or offer clarity. If CTR is high but conversions are weak, the problem may be landing page fit or traffic quality.
Why High Instagram CTR Does Not Always Mean Success
A high Instagram CTR feels good, but it can hide weak business results. Clickbait creative can lift CTR while lowering lead quality. A broad giveaway can drive clicks from people who never intend to buy, while a curiosity-based headline can send visitors to a page they quickly leave. The same post-click problem appears across paid acquisition channels, where tracking lead quality helps separate raw clicks and form submissions from leads that actually become viable opportunities.
That is why CTR should be reviewed with other metrics:
- conversion rate
- cost per conversion
- cost per qualified lead
- ROAS
- bounce rate
- time on page
- email sign-ups
- purchases
- booked calls
- lead quality
CTR tells you whether people clicked. The rest of the funnel tells you whether they were the right people and whether those clicks created useful business results.
The Smarter Way To Read Instagram Click Through Rate
Instagram click through rate is a useful signal, but it should never be the only metric in the report. For ads, a practical broad reference is often around 0.5%–1.5%, with results moving higher or lower depending on placement, audience, objective, creative quality, and CTR definition. For bio links and Story links, your own past performance is usually a more useful benchmark because organic click behavior varies so much by niche and audience.
A good Instagram CTR means your content earned action. A great Instagram strategy goes one step further and asks whether those clicks became leads, sales, subscribers, or meaningful business results.